25brands
Spot the next breakout early
Across 9 device categories, 25 brands at least doubled their share year over year.
Early partnerships, rising brands Now in early access

Hear Japan's core gamers in their own words, and decide faster.
Best-selling and best-loved are different brands
in 9 of 10 categories.
Sign up free to try the console in the demo environment.
3 survey years loaded so far. Earlier years are being added.
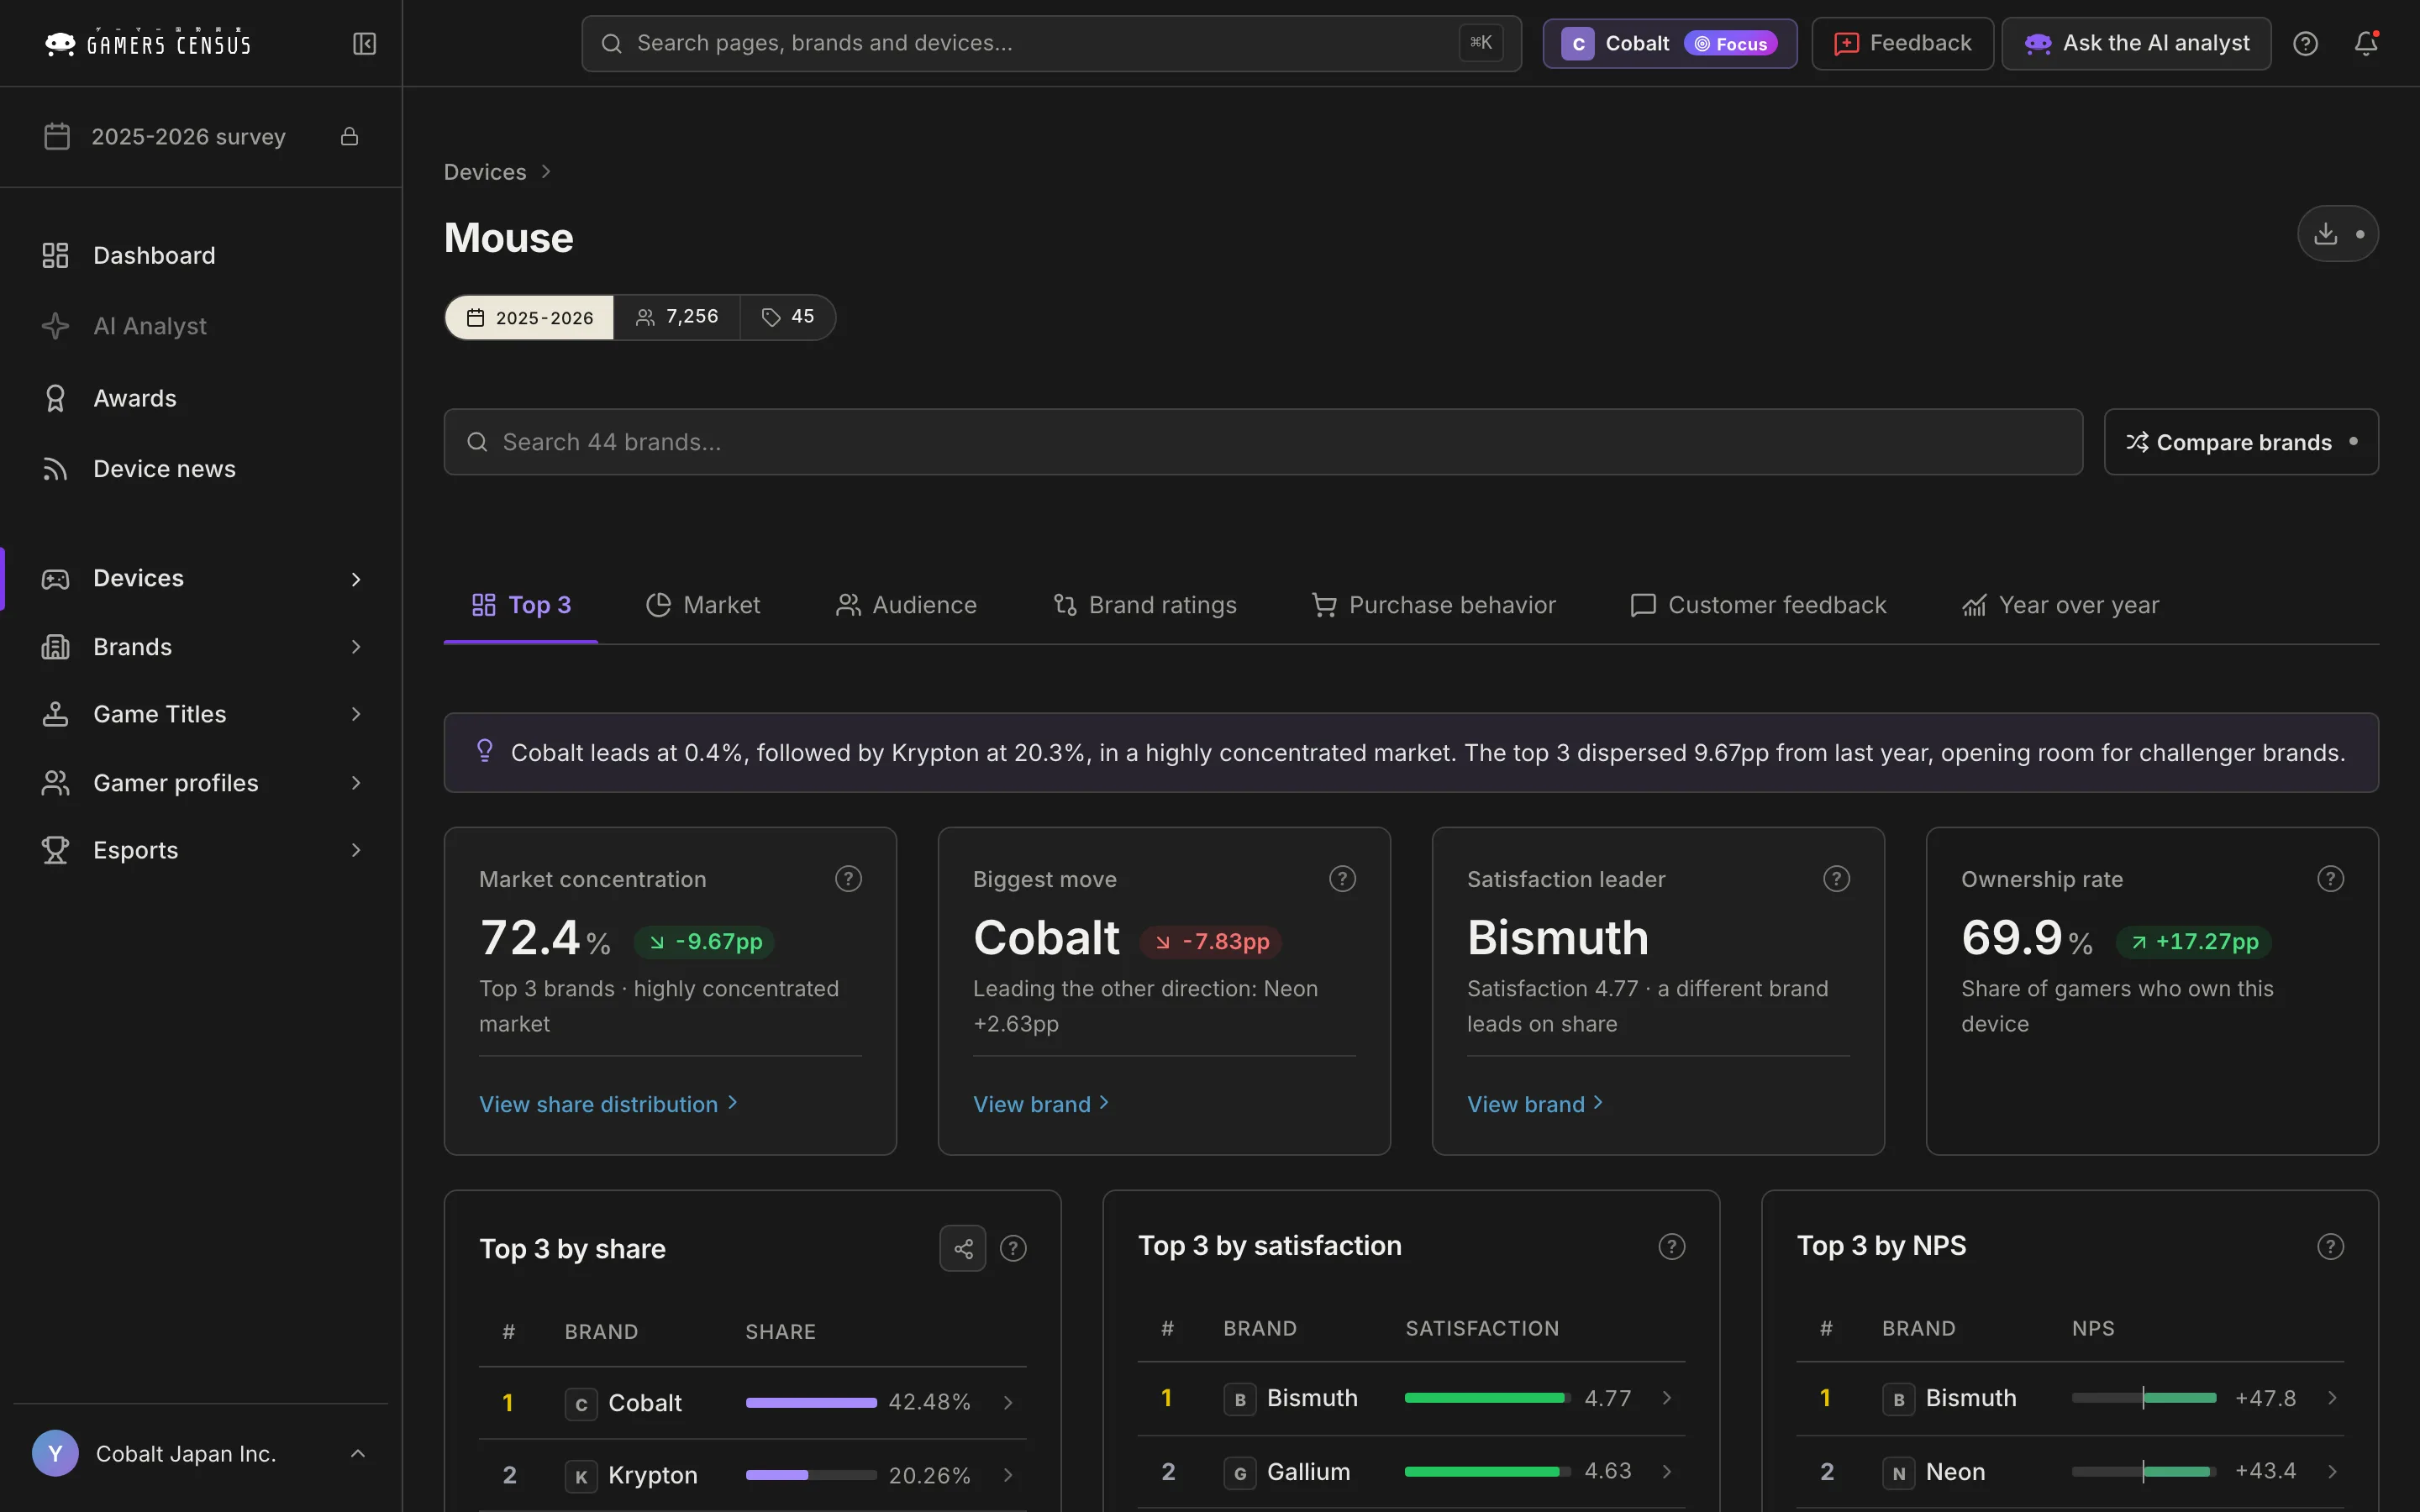
Global market reports tell you how big Japan is. They rarely tell you why a Japanese competitive player picks one mouse over another. Gamers Census is built for that second question.
Not the average of everyone who owns a console. We focus on the high-involvement, competitive players who actually drive peripheral purchases, where mass surveys lose the signal.
Break share, satisfaction, NPS, purchase drivers and open-ended comments down by brand, category and segment. The finer the cut, the sharper the decision.
Complaints gamers would never send to a brand directly come out in an independent survey. You read the candid criticism as it was written.
Price sensitivity, brand loyalty and community dynamics work differently in Japan. A dedicated team records them every year.
Not resold panel data, not scraped reviews. Primary data you cannot get anywhere else.
It is run by fpsjp.net, one of Japan's largest sites dedicated to FPS and gaming devices, whose team has served as jurors for The Game Awards. The awards drawn from the results have recognized winners in 129 award categories across three years.
Across 9 device categories, 25 brands at least doubled their share year over year.
Early partnerships, rising brandsThe gap between the two leaders shows you where to attack and where to defend.
Competitive position, brand strategy72,062 free-text comments from the latest year, broken down by theme and sentiment. See what earns praise and where the improvement opportunities are, in numbers rather than impressions.
Product improvement, voice of the customerEvery gaming outlet read by at least 1% of respondents, plus favorite streamers sorted into human streamers and VTubers, with year-over-year growth. Roughly one in four streamer names was a VTuber.
Sponsorships and media buyingThis is what real purchases by Japan's core gamers look like in the console.
Share, satisfaction, recommendation and ownership for each category, plus market concentration and the fastest-growing brands. A starting point for product planning and improvement.
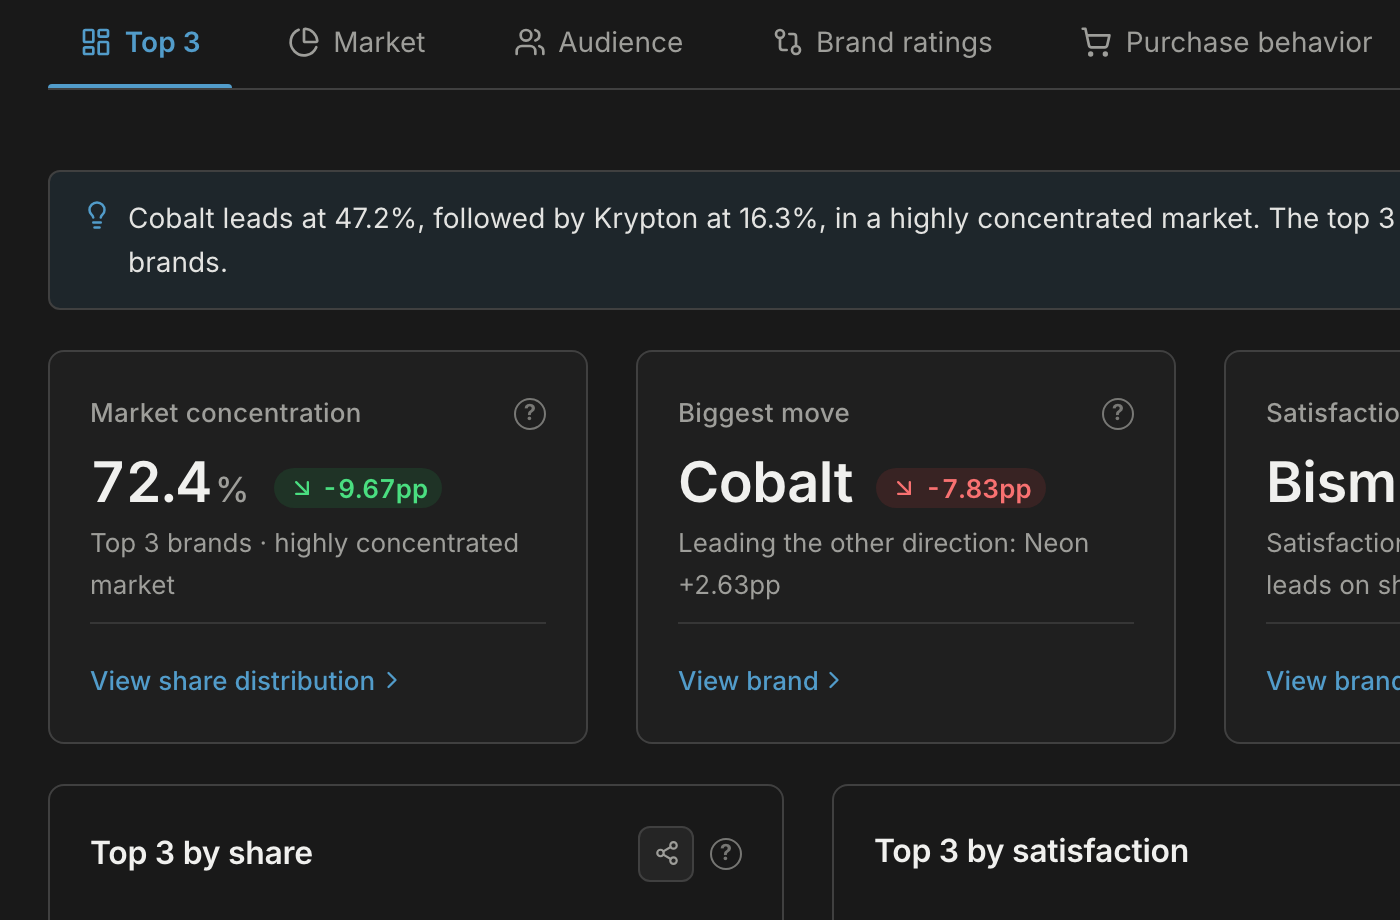
Year-over-year share, satisfaction and recommendation for every brand. Trend lines appear once three comparable years are in: each new survey year adds more change you can track.
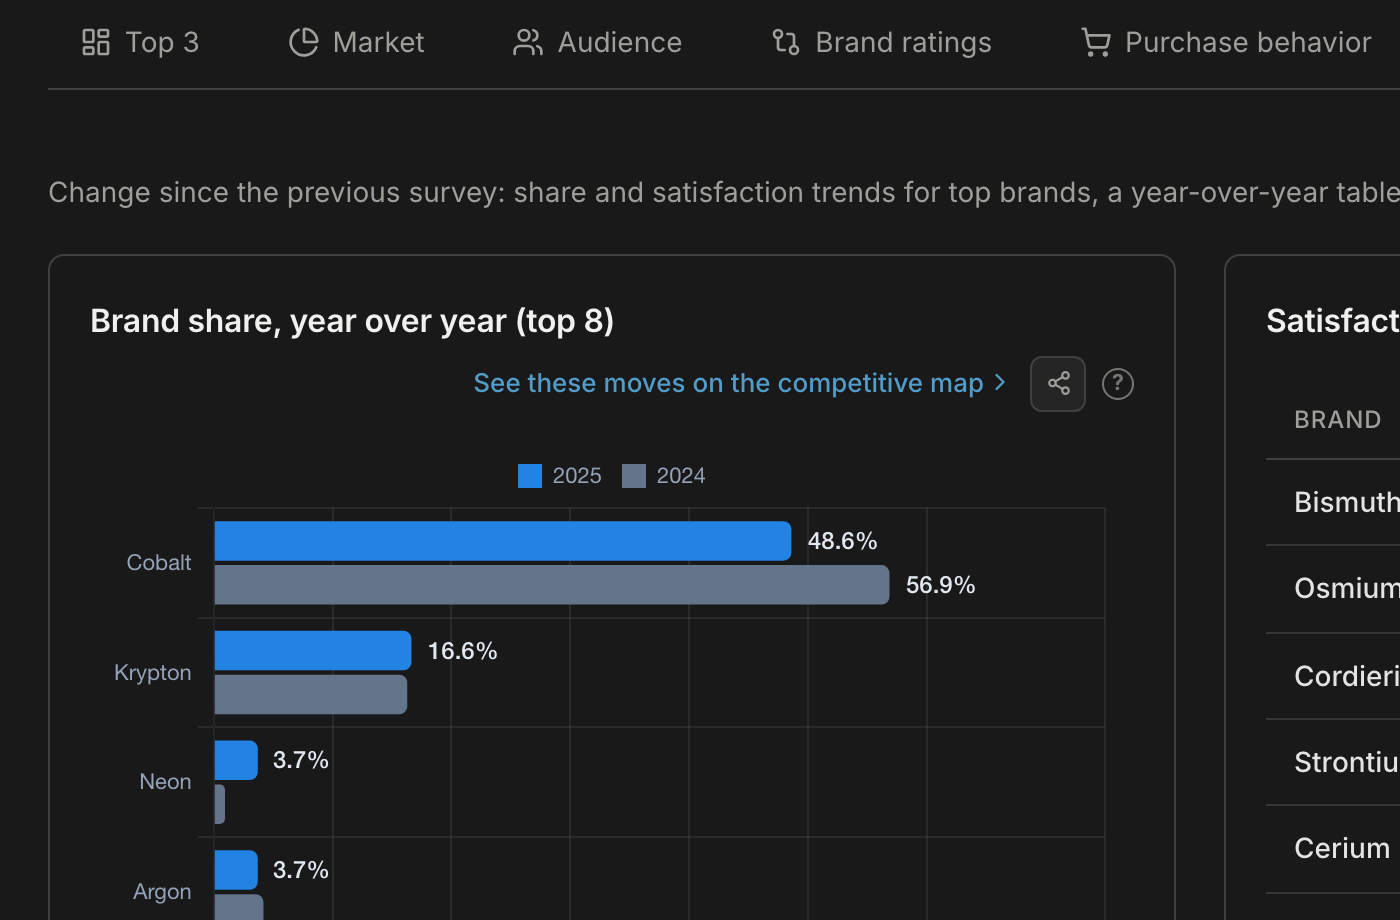
Pick two brands. Share, satisfaction, recommendation and awards line up in two columns, with the leader marked on every row. Nine views, from strengths and challenges to audience, year over year and user voices, show where you win in Japan and where you lose.
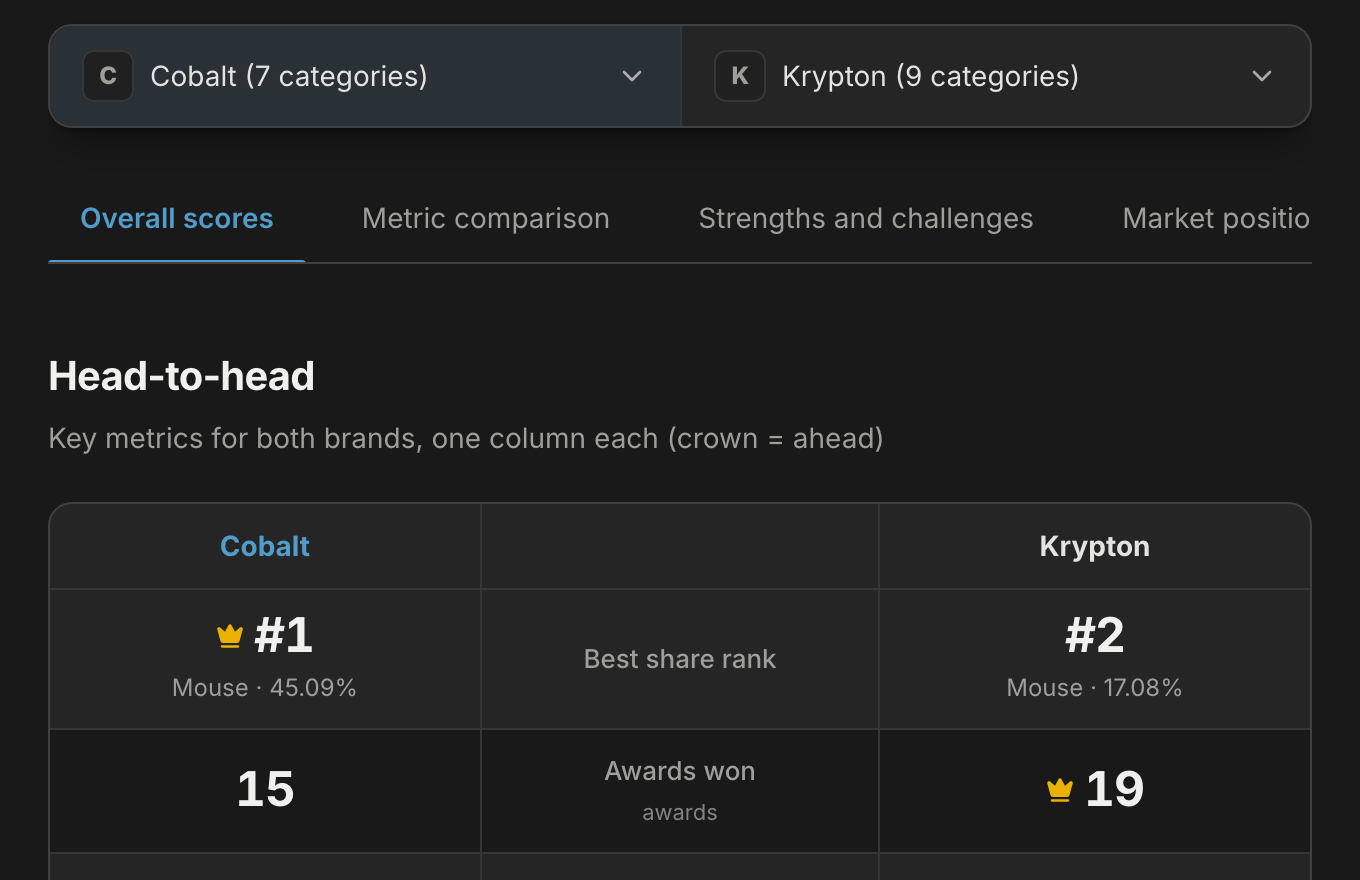
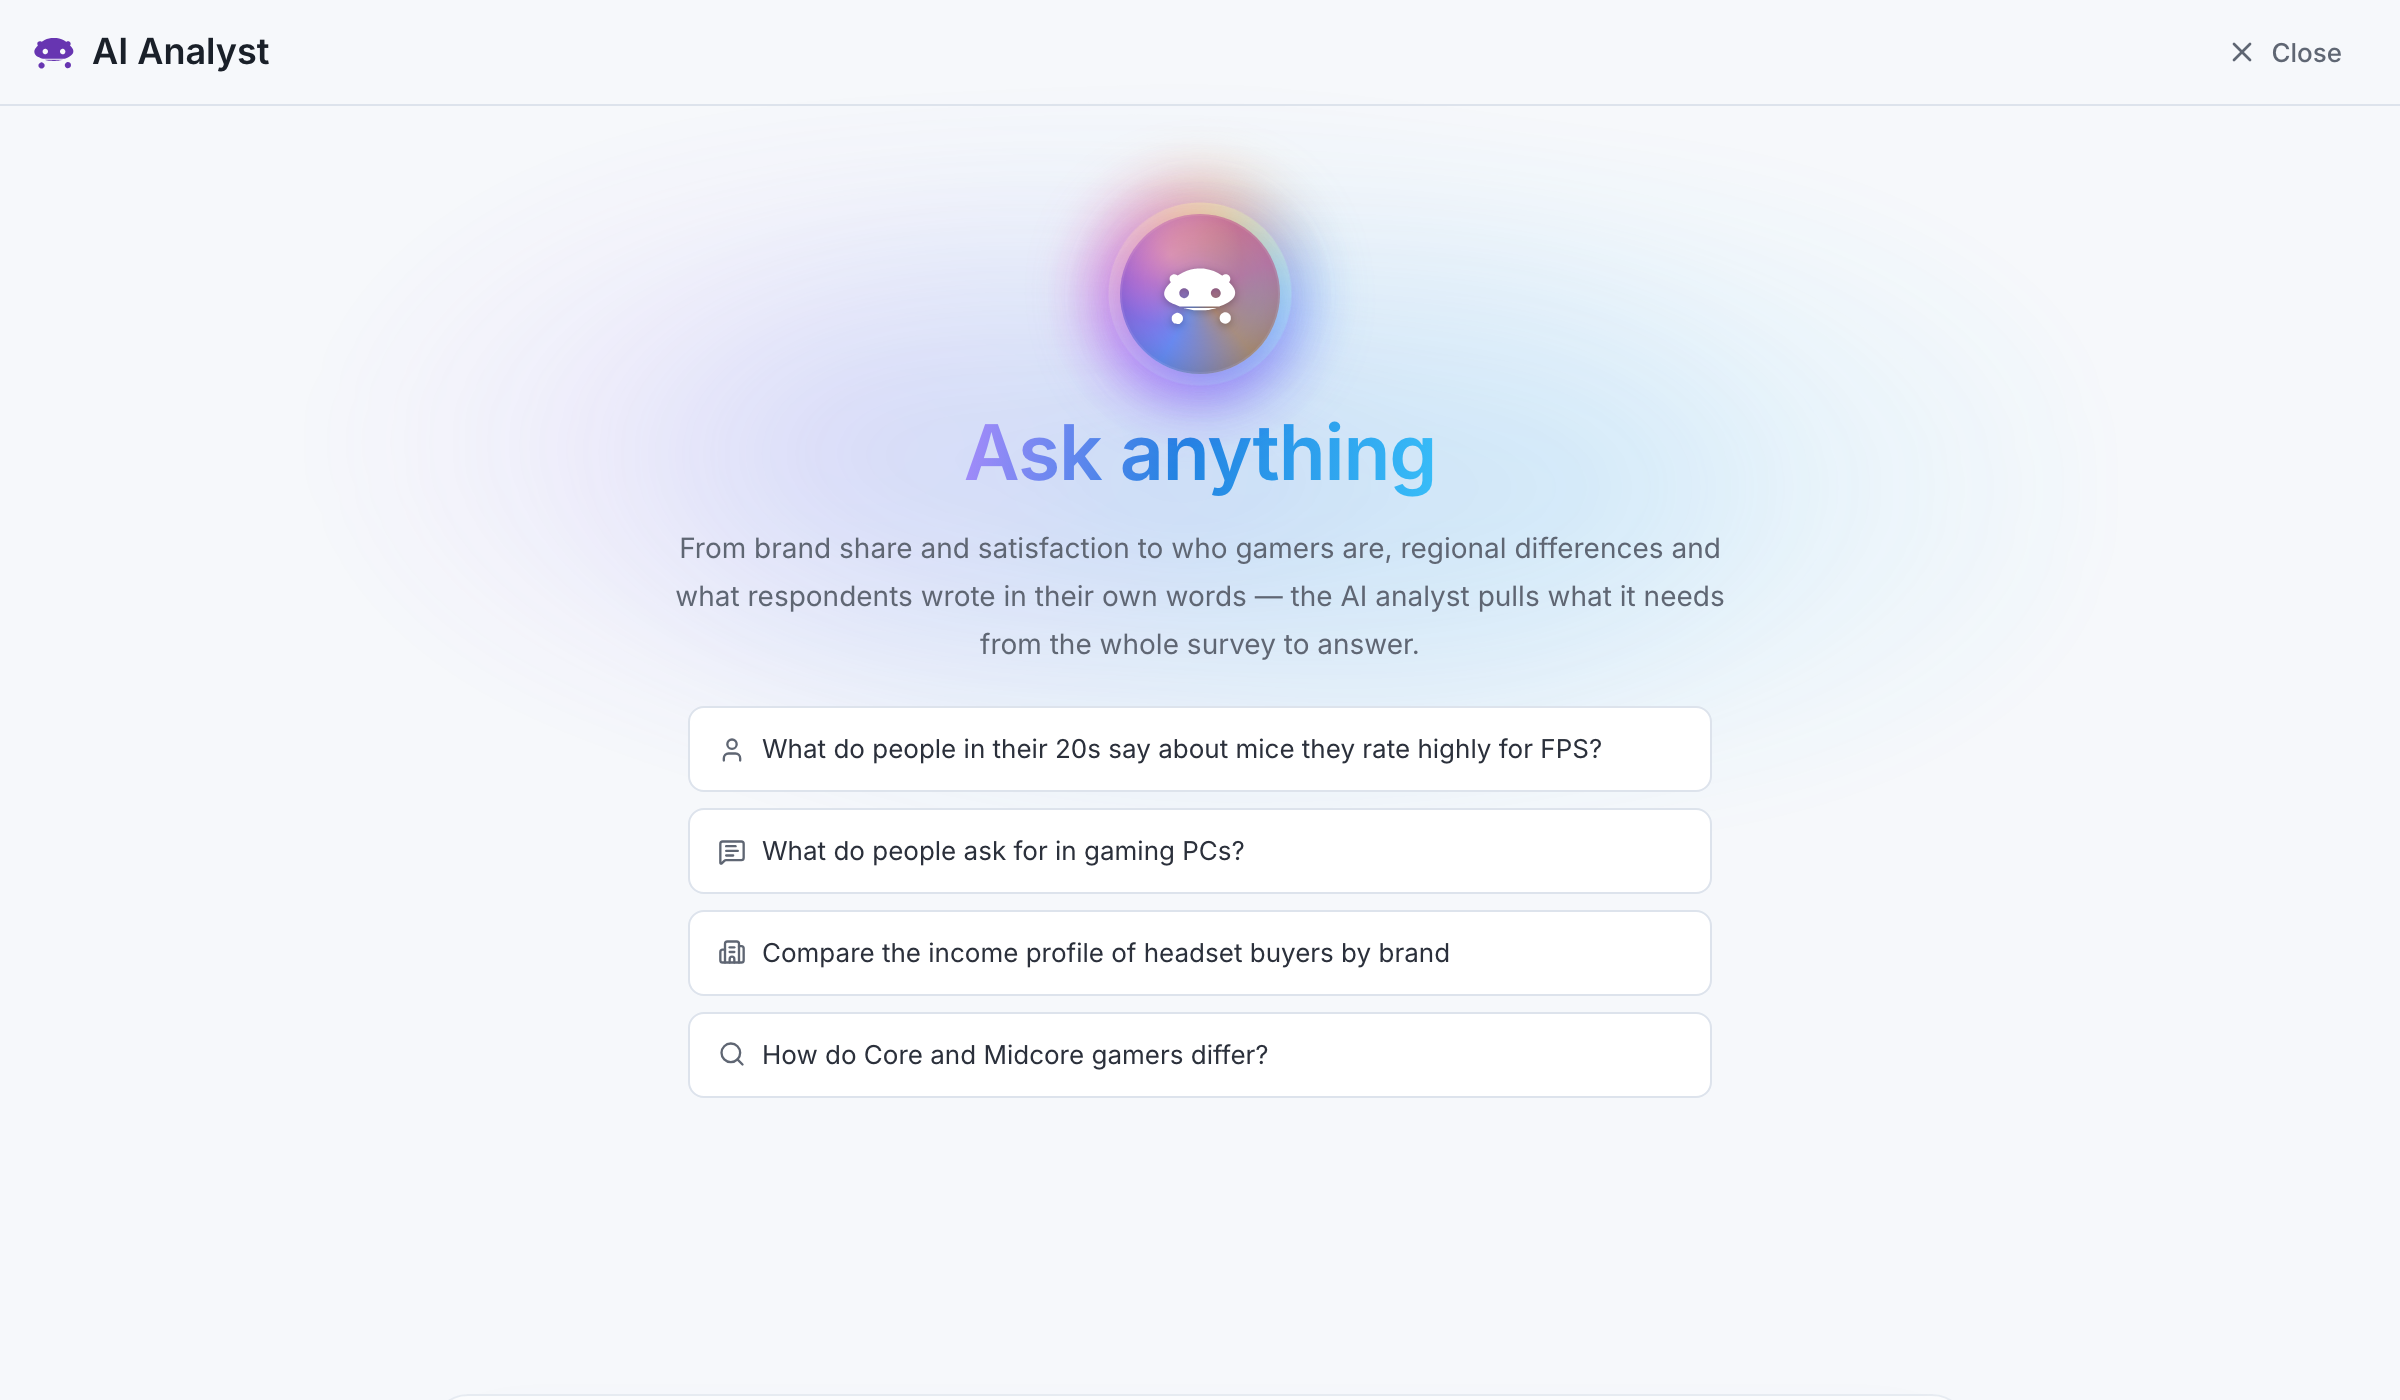
Ask "Which mice do FPS players in their 20s rate highest?", "Which streamers do our headset's users watch?" or "What do players complain about most with gaming PCs?" The AI combines full-text comment search with cross-category numbers, then pulls out and summarizes the answer.
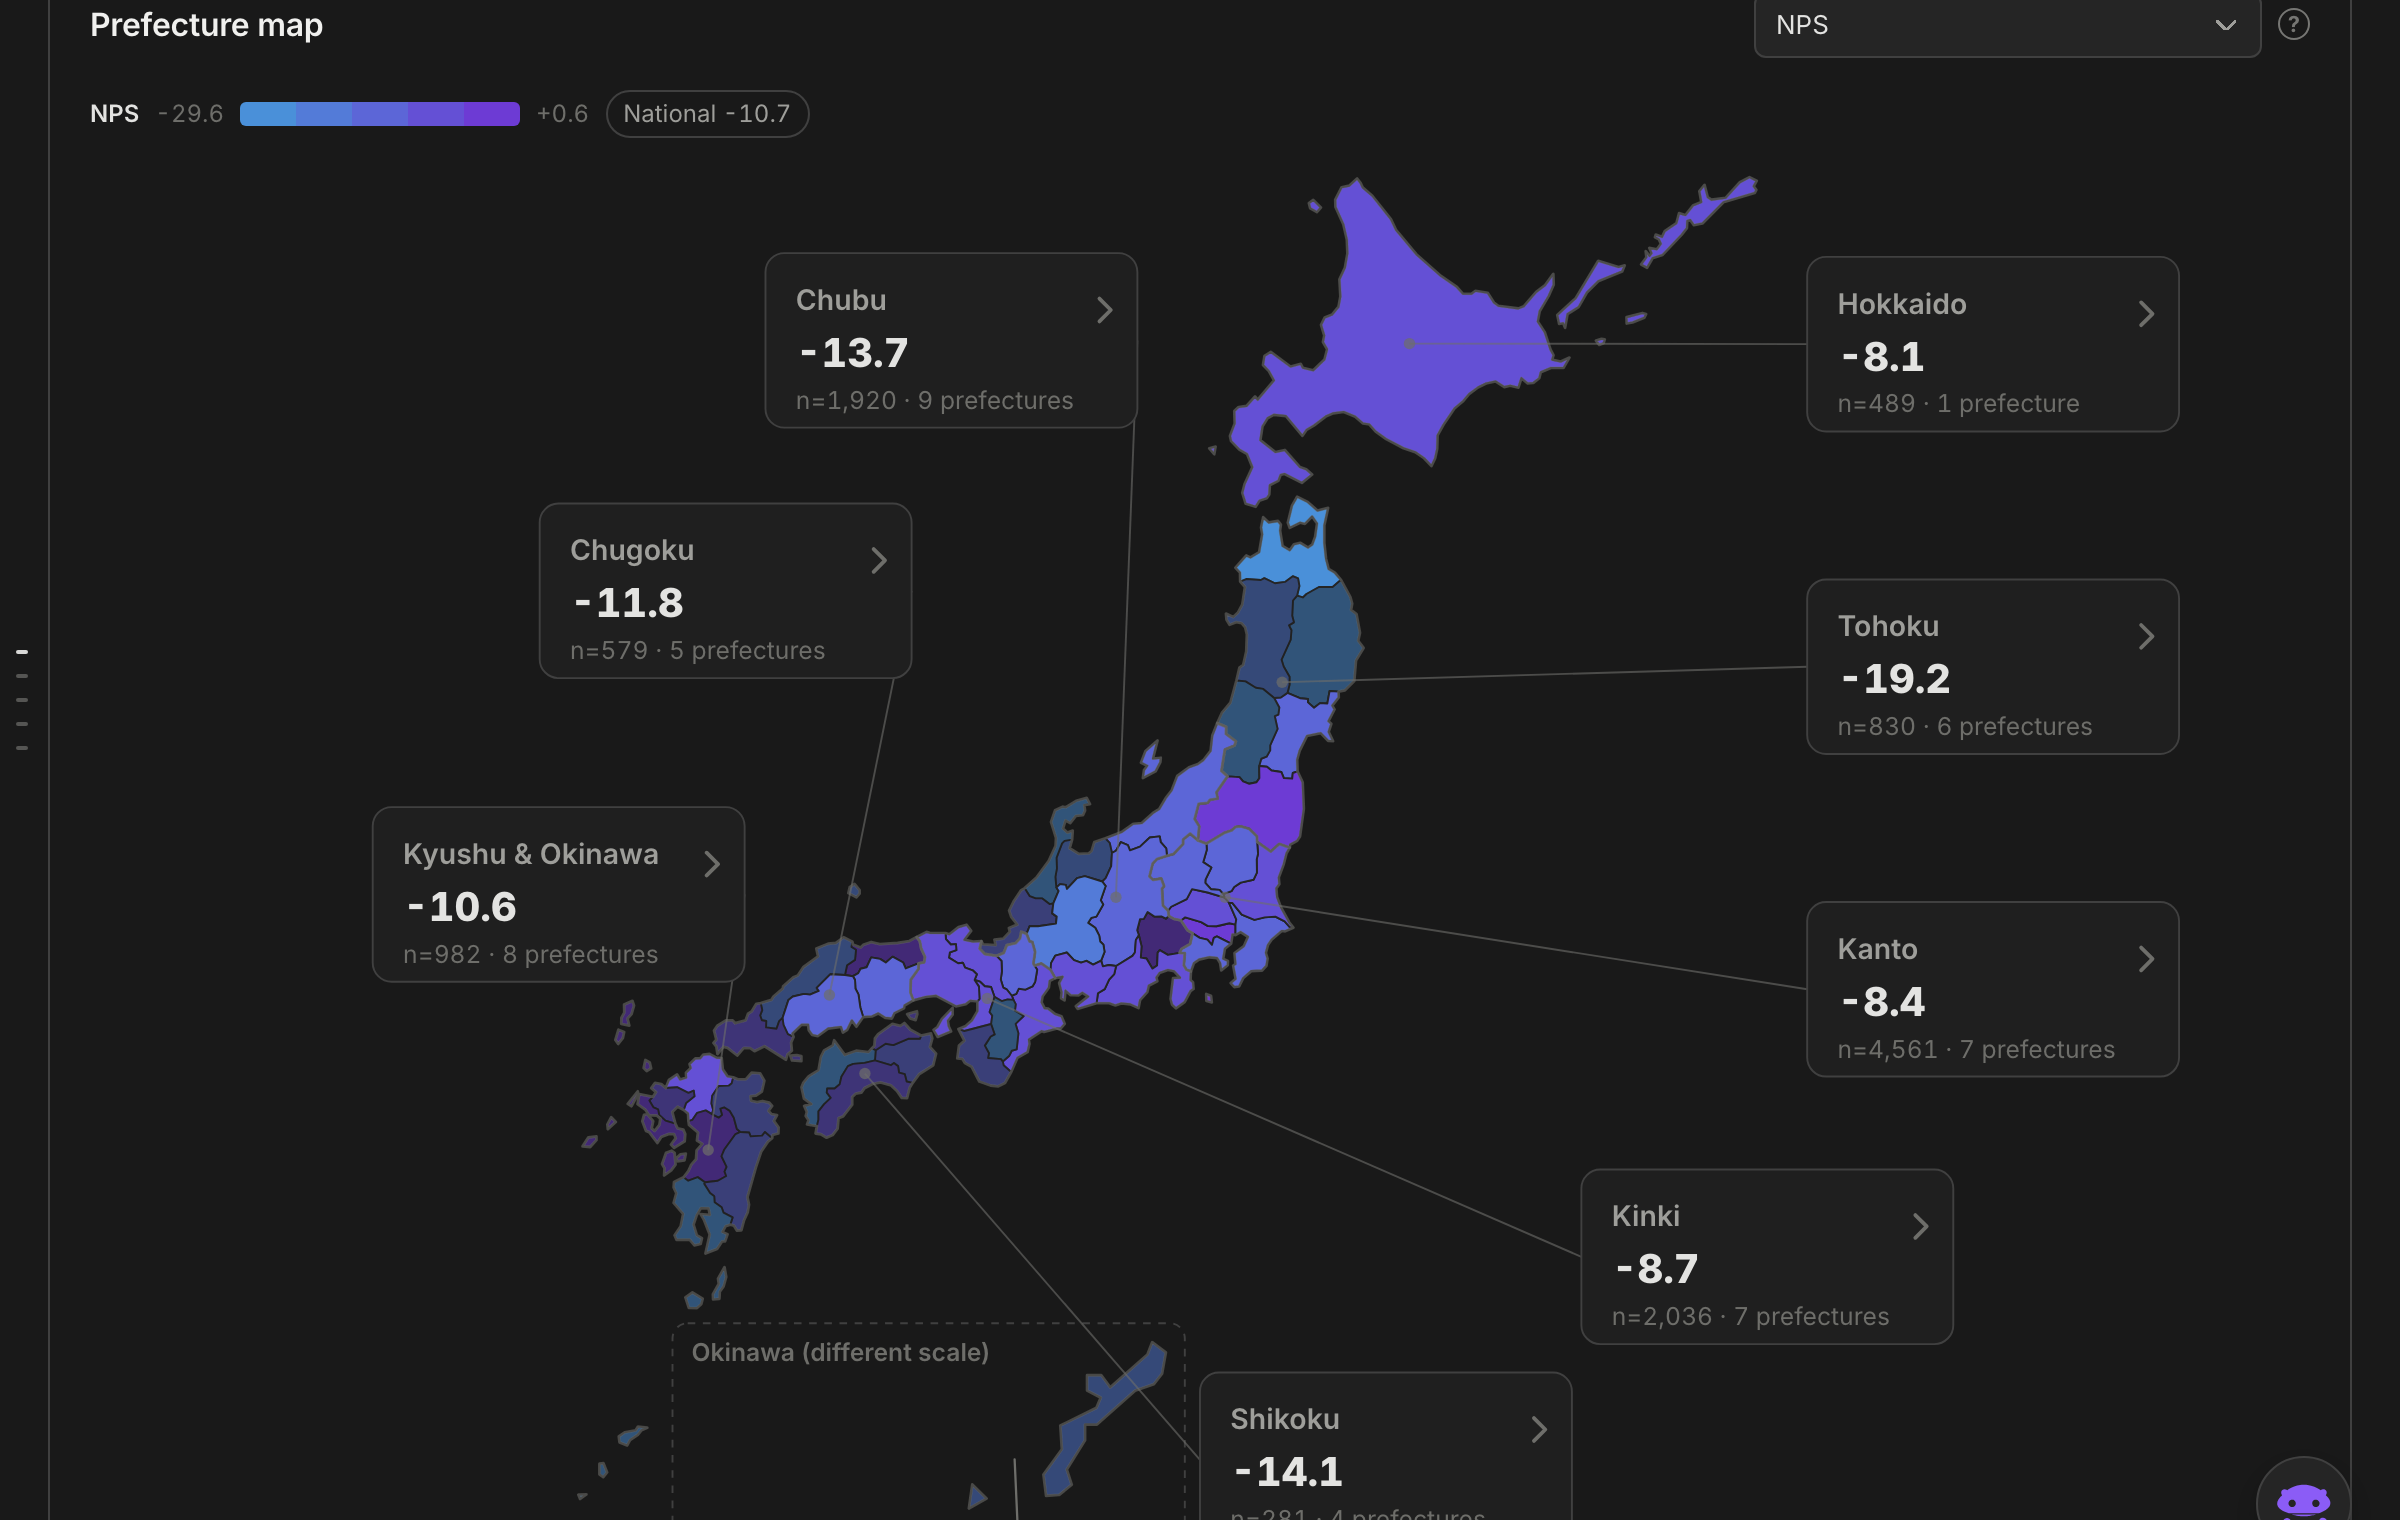
Respondents, play setups and device preferences mapped across Japan's 47 prefectures. Compare regions and ground your local targeting in data.
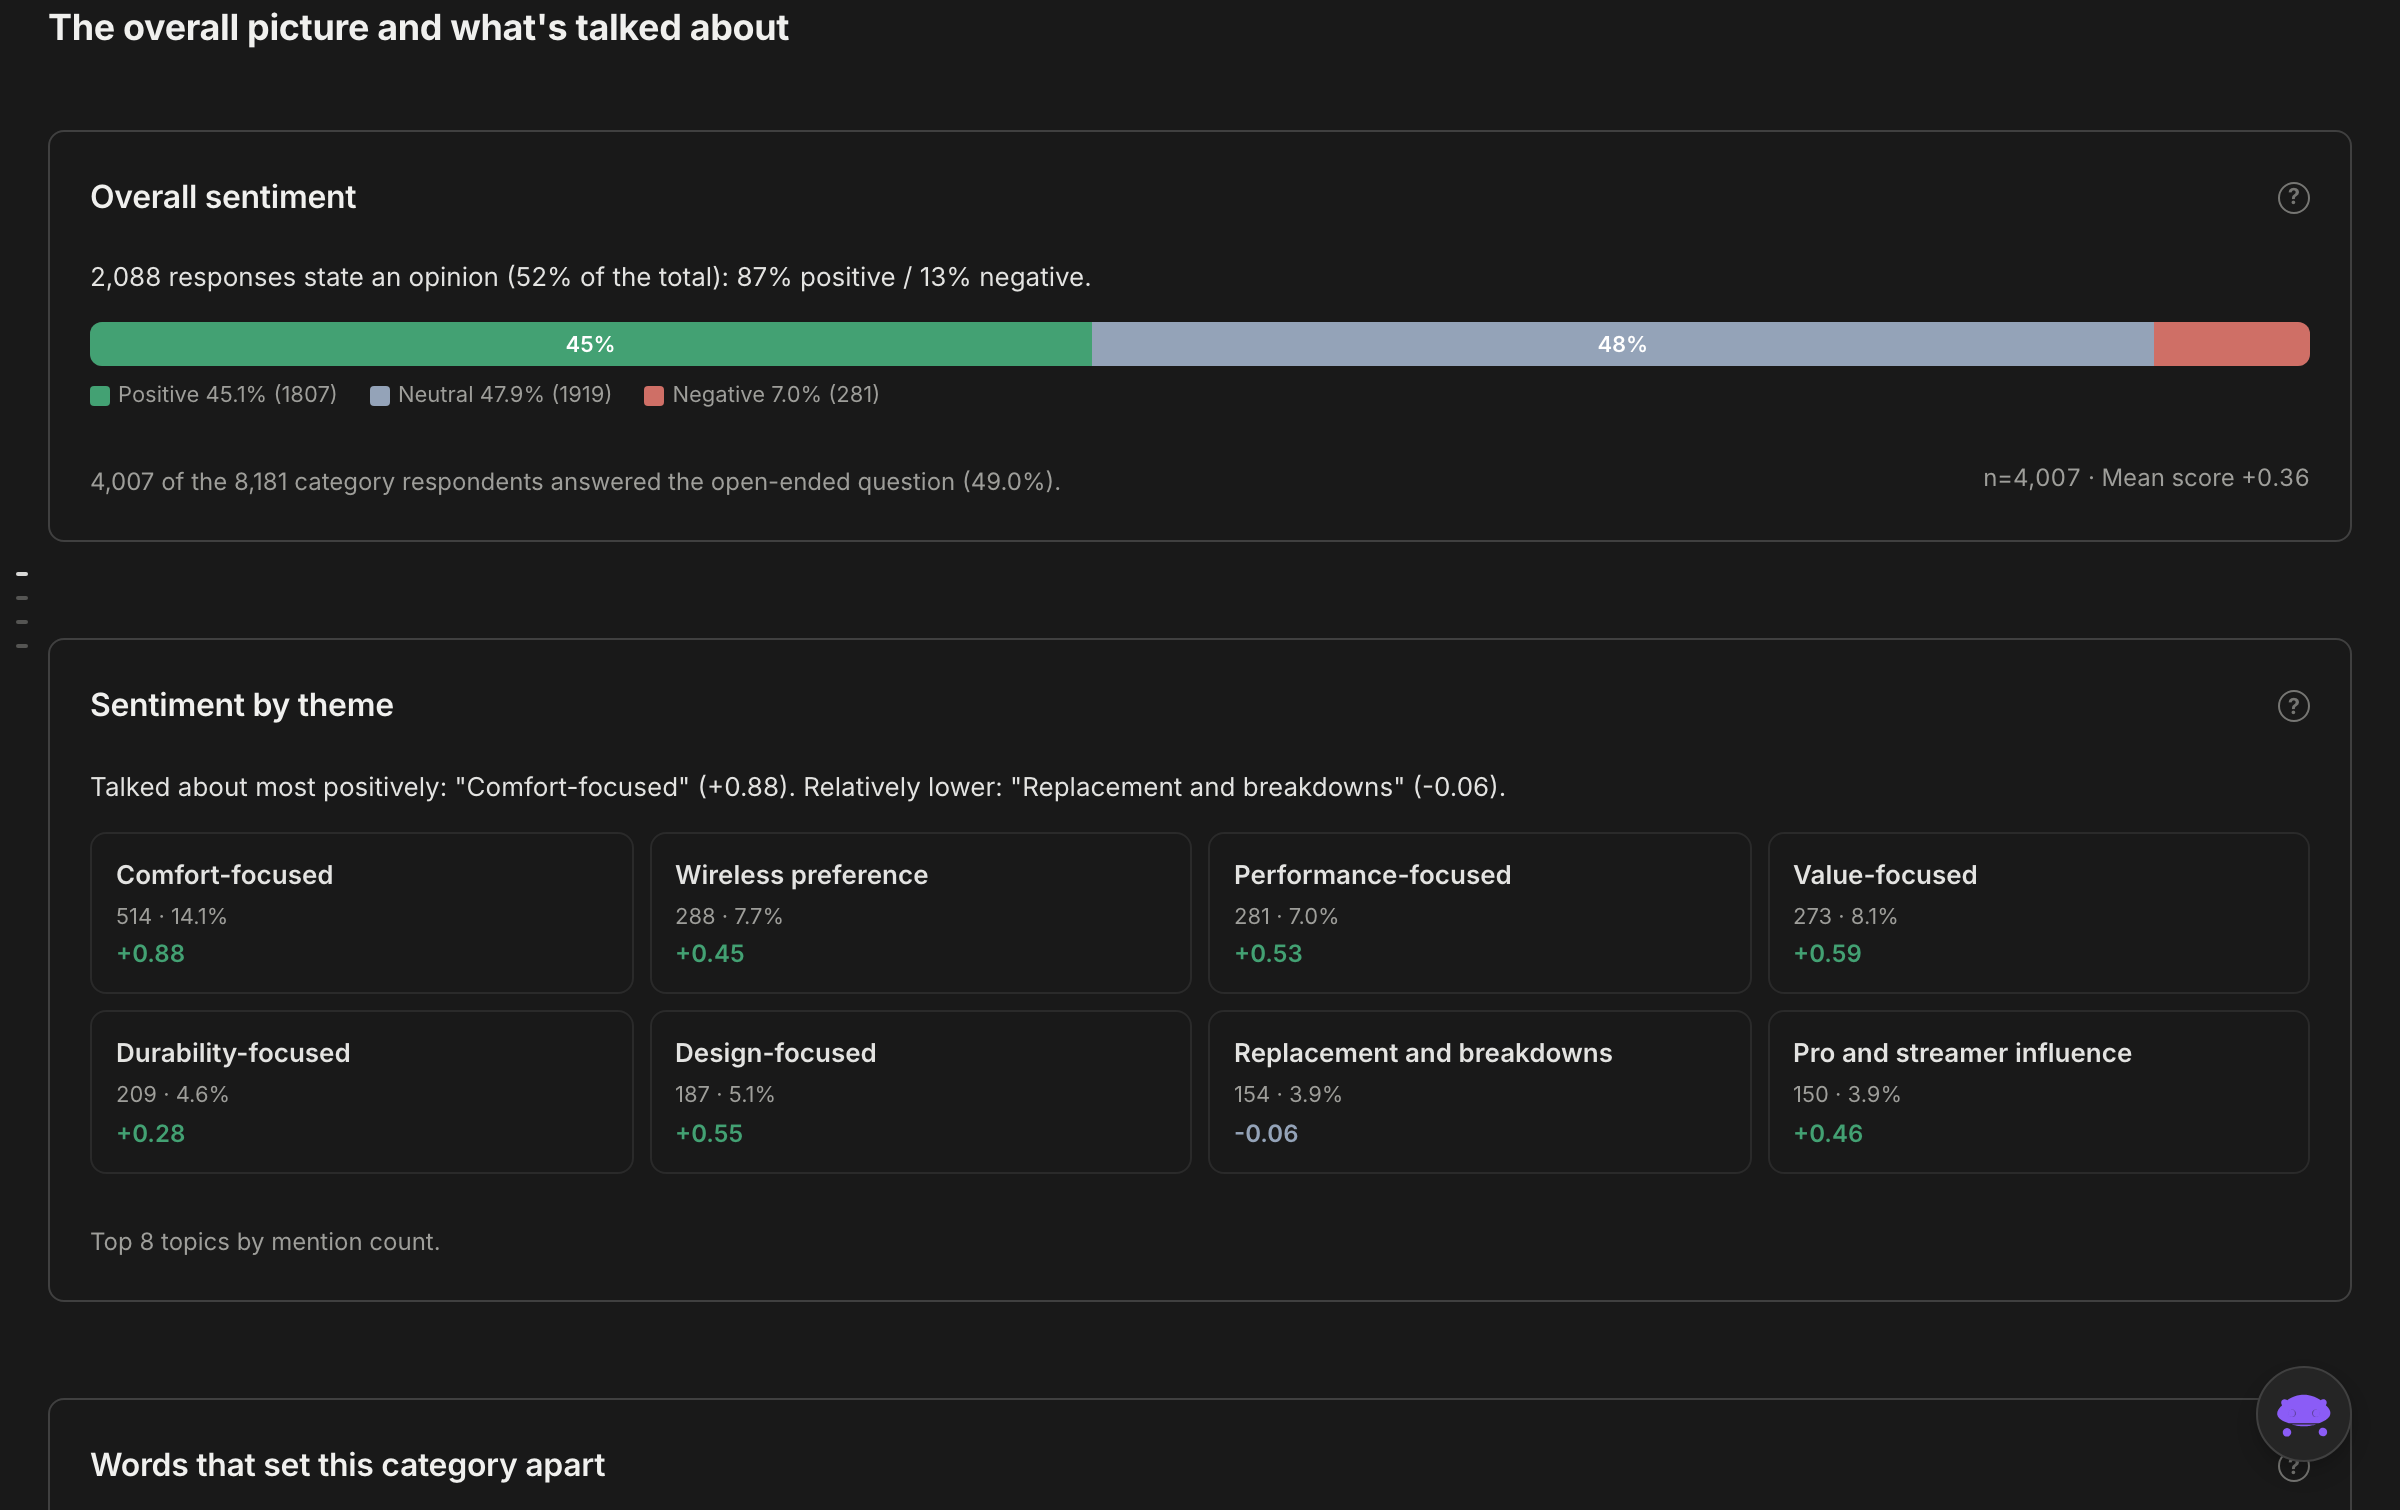
Market position, what gamers say, competitors and awards: seven views on every brand.
Cross age, income, gender and play setup with brands. See exactly which segments a brand wins.
Age, income, play time and play style combined into a clear picture of who Japan's core gamers are.
Download CSV for Excel or your BI tool. Annual reports print or save as PDF.
Cite or embed individual cards so the numbers travel into your reports and articles intact.
160,537 open-ended comments across all years, from the totals back to the original words.
STATE OF GAMING DEVICES, the yearly review of the device market, in 15 chapters for each brand. Ready to circulate internally as is.
Available features depend on your plan. Compare plans
All of this is open before you buy anything.
Switch years, categories, brands and demographics and run the analysis yourself. Brand names and figures are samples.
See how category analysis, brand analysis and open-ended comments look, in a format easy to share with your team.
Methodology, covered categories, release notes and FAQs are on public pages. No sign-up needed.
Different roles need different numbers. Each decision below gets a basis in primary data.
How you get from first look to contract.
Registration takes a moment. Start with whichever screen interests you.
Contact us and we'll walk you through the console and pricing for your topic.
Once you know what you need, pick a plan or a pass.
Choose from three plans: Standard to see the market, Professional to analyze it, Enterprise to connect it to your own data.
The 10 device categories go deep on share, satisfaction, and comments.
Multi-year analysis, plus in-app export and data delivery.
A bespoke report structured around your questions, multi-department access and invoice-based payment.
Passes for just your brand or just the categories you need are also available. See passes
Signing up and trying it out costs nothing.